
Power BI Table Images: A Step-by-Step Guide to Mastering Image Visualization

Bali Travel Map – PowerBI
05/12/2023
How to Enable Power BI Slicer Search Function?
07/12/2023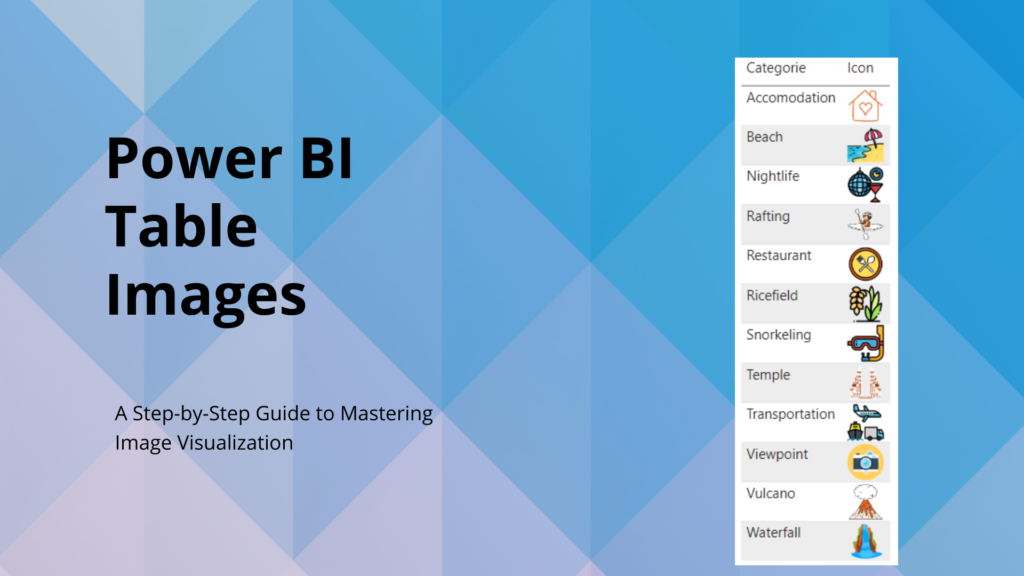
Introduction
Welcome to my guide on ‘Power BI Table Images’! As a frequent user of PowerBI, I’ve often grappled with the challenge of making data tables more visually engaging. A solution I’ve found quite helpful is integrating images into PowerBI tables. It’s a subtle enhancement, but it adds a meaningful touch to data presentation. This guide is all about sharing those insights.
Finding straightforward answers on how to add images, especially practical tips beyond the basics covered in forums and sites like StackOverflow, can be a bit of a hunt. That’s why I’ve put together this step-by-step guide. It aims to demystify the process of using measures and image URLs to bring life to your PowerBI tables. So, let’s dive into the world of PowerBI Table Images and explore how to transform your data visuals!
Why Use Power BI Table Images?
- Enhanced Visual Appeal: Using Power BI Table Images adds a significant visual element to the data, making tables more engaging and visually appealing than those with only text and numbers.
- Quick Data Comprehension: Images in Power BI tables serve as quick visual cues that help users understand complex information rapidly, enhancing data comprehension.
- Effective Categorization: Incorporating images into PowerBI tables aids in categorizing and differentiating data points more intuitively, which is especially useful when dealing with large datasets.
- Improved User Experience: The integration of images in Power BI reports, particularly in tables, creates a more interactive and enjoyable data exploration experience for users.
- Universal Communication: Images used in PowerBI tables break language barriers, making the data more universally understandable and accessible to a diverse audience.
Steps for Integrating Images into a Power BI Table
Integrating images into your PowerBI tables involves a few critical steps. Let’s walk through them using my example where I add icons to various locations in Bali.
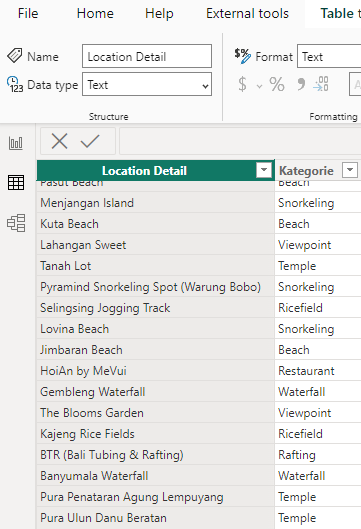
1) Assessing Your Current Data Structure
Examine the Existing Data: First, look at your current data structure. In my case, I have a list of locations in Bali. Make sure you have the essential columns; for me, it’s the ‘category‘ column.
The Role of the Category Column: This ‘category’ column is vital as it will later help in associating each location with its corresponding icon.
2) Select Suitable Images for your Power BI table
Finding Images: For the right visual representation, I turn to google or websites like flaticon. For instance, search for ‘beach icon’ to find a relevant image for your category. In this case i went to google and went to the image section.
Obtain Image URLs: Right-click on the chosen image and select ‘Copy image address’ or ‘Save image URL’. These URLs are essential for displaying images in your PowerBI table.
3) Craft the Measure
In this step, you’ll create a new measure in PowerBI, which is crucial for linking your data to the appropriate images. The SELECTEDVALUE function plays a key role here. Here’s a quick breakdown of what this measure does and how it works:
- Function of the Measure: It connects the ‘Category’ column in your table to corresponding image URLs.
- How SELECTEDVALUE Works: This function identifies the current category in each row (like ‘Beach’ or ‘Mountain’) and then retrieves the matching image URL.
- Result: As your table data changes, the images update automatically, ensuring that each category is always represented by the correct icon.
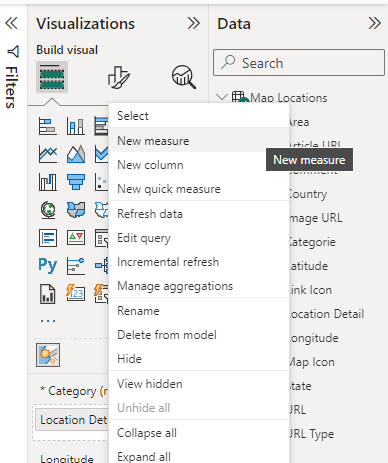
Now create your measure:
–> Right click on the table where you stored the data and select “New Measure”
I have not only images for the beach but I selected 12 different images in total, all using the same function:
My measure, in this case, is called “Map Icon” and now I am referencing my table “Map Locations” and the column “Kategorie”. As you can see some URLs come from flaticon and some come from my travel blog website ikaandlukas
You can copy and paste the code below. You just need to change the table name, the column and also the image URL if you want to display other images.
Map Icon =
SWITCH(True(),
SELECTEDVALUE('Map Locations'[Kategorie])  = "Rafting", "https://ikaandlukas.com/wp-content/uploads/2023/12/5.png",
SELECTEDVALUE('Map Locations'[Kategorie])  = "Snorkeling", "https://cdn-icons-png.flaticon.com/512/1728/1728691.png",
SELECTEDVALUE('Map Locations'[Kategorie])  = "Restaurant", "https://ikaandlukas.com/wp-content/uploads/2023/12/12.png",
SELECTEDVALUE('Map Locations'[Kategorie])  = "Ricefield", "https://cdn-icons-png.flaticon.com/512/898/898133.png",
SELECTEDVALUE('Map Locations'[Kategorie])  = "Waterfall", "https://ikaandlukas.com/wp-content/uploads/2023/12/2.png",
SELECTEDVALUE('Map Locations'[Kategorie])  = "Vulcano", "https://ikaandlukas.com/wp-content/uploads/2023/12/8.png",
SELECTEDVALUE('Map Locations'[Kategorie])  = "Viewpoint", "https://cdn-icons-png.flaticon.com/512/235/235821.png",
SELECTEDVALUE('Map Locations'[Kategorie])  = "Nightlife", "https://cdn-icons-png.flaticon.com/512/5067/5067121.png",
SELECTEDVALUE('Map Locations'[Kategorie])  = "Temple", "https://ikaandlukas.com/wp-content/uploads/2023/12/11.png",
SELECTEDVALUE('Map Locations'[Kategorie])  = "Transportation", "https://cdn-icons-png.flaticon.com/512/995/995260.png",
SELECTEDVALUE('Map Locations'[Kategorie]) = "Beach", "https://cdn-icons-png.flaticon.com/512/7894/7894015.png",
SELECTEDVALUE('Map Locations'[Kategorie]) = "Accomodation", "https://ikaandlukas.com/wp-content/uploads/2023/12/1.png"
)
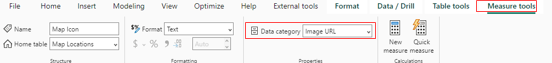
4) Convert the new measure to Image URL type
This is an important step! Without it, no picture will show up! Once the measure is created, click on it and in the navigation pane under “measure tools” select the data category “Image URL”
5) Create a Powerbi table
Now it’s time to add the Power BI table to the canvas. After adding the Kategorie column and the newly created measure, you will get this output. The only thing you have to keep in mind is changing the image size. Under the visualization tab click on Image size and then select a smaller size. In my case height and width of 35 work perfectly.
Conclusion
In conclusion, integrating Images in Power BI tables, particularly through PowerBI Table Images, can significantly enhance data visualization. This guide has walked you through the steps of adding dynamic images to your tables, making your data more engaging and accessible. The use of measures like SELECTEDVALUE demonstrates PowerBI’s capability to create visually appealing and informative reports. Remember, these small changes can make a big difference in how your data is perceived and understood. Happy data visualizing in PowerBI!

