
How to Merge Polygons in QGIS: Improve Geospatial Analysis

How to Create a Dynamic Territory Report in Power BI for Germany
19/12/2023
Year-over-Year Comparison with Deneb Custom Visual
26/12/2023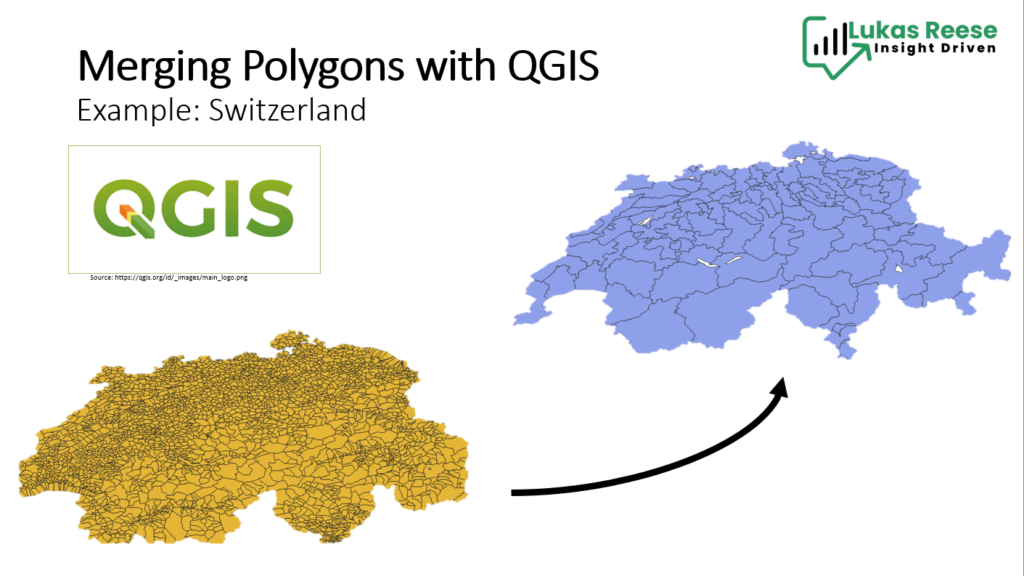
Geospatial analysis is all about making sense of data based on places and locations. In this post, we’re focusing on how to use a tool called QGIS to merge polygons. This means taking smaller bits of a map, like specific postcodes, and combining them into bigger areas. This method helps us see the big picture, like how sales trends work across different regions. Using QGIS for merging polygons simplifies the data, making it easier to understand and use for our analysis.
The Significance of Geographic Analysis in Today’s World
Understanding spatial data and geographic trends is crucial in various fields, from urban planning to market analysis. Geographic analysis allows us to visualize complex data, identify patterns, and make informed decisions. In this context, tools like QGIS become indispensable for handling and interpreting spatial data effectively.
Today, we will reshape and merge the 4 digit postal code polygons of Switzerland. Often the detailed postal code level has too many polygons and maps in Power BI struggle with the number of polygons. Plus, it can make the analysis and your report very slow!
Understanding Geographic Information Systems (GIS)
Geographic Information Systems (GIS) are powerful tools for visualizing and analyzing spatial data, extending far beyond simple map creation. GIS integrates location data with descriptive information, offering a foundation for detailed mapping and analysis used in various industries. This technology helps in understanding complex patterns, relationships, and geographic contexts, enhancing decision-making and communication.
Specifically, polygons in GIS play a crucial role. They represent areas like cities, lakes, or postcodes on maps. The process of merging polygons in QGIS, a popular GIS software, is particularly beneficial. It simplifies detailed data, such as postcodes, into broader, more manageable regions for analysis. This technique is vital for gaining a more strategic overview of spatial trends and patterns, making drawing meaningful conclusions from the data easier. For a deeper understanding of GIS, you can explore more at Esri’s GIS Overview.
What are Polygons?
Polygons are key features in GIS, representing various boundaries on maps, like postal codes or city limits. They are formed by connecting multiple points, each defined by latitude and longitude coordinates, creating a defined area on a map. For example, to depict a neighborhood, points around its perimeter are identified and connected in sequence.
Polygons in GIS are defined by a series of latitude and longitude coordinates that outline a specific area. For instance, a polygon representing a small park might be coded as follows:
"geometry": {
  "type": "Polygon",
  "coordinates": [
    [
      [longitude1, latitude1],  // Point 1
      [longitude2, latitude2],  // Point 2
      [longitude3, latitude3],  // Point 3
      [longitude4, latitude4],  // Point 4
      [longitude1, latitude1]   // Back to Point 1
    ]
  ]
}
Each pair of longitude and latitude values represents a corner of the polygon. In this example, the polygon is closed by returning to the first point. For a more detailed explanation and examples, you can visit Spotzi’s description of polygons. Now that you understand the most important concepts, let’s merge Polygons in QGIS!
Merge Polygons in QGIS: Step-by-Step
1. Download QGIS:
Head over to the official QGIS website and download QGIS Desktop version. Simply follow the installation procedure. The use of the tool is free!
2. Connect to GeoJson or Shape File
Now its time to connect your GeoJson file. You can also use shape files as well!
- Click on the Data Source Manager
- A new window will open
- Click on the three dots (…) and select your GeoJson or Shape file
- Click on Add
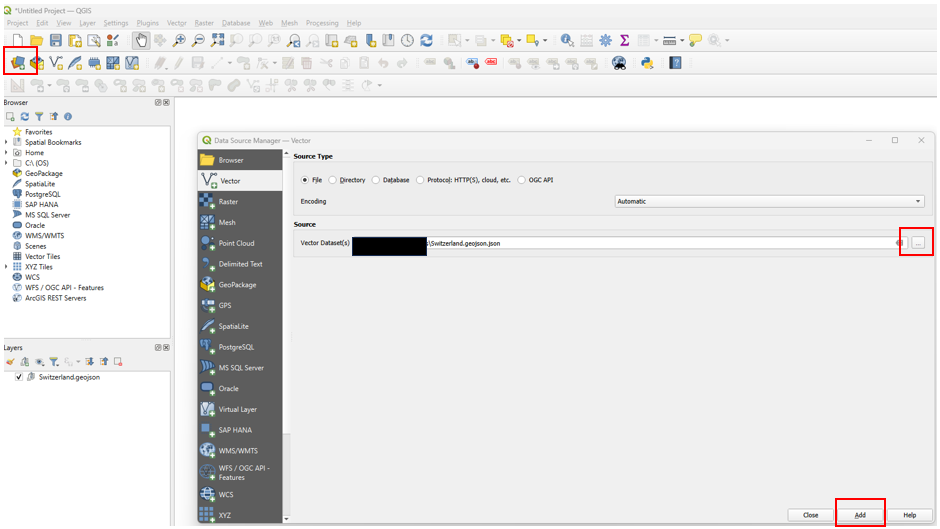
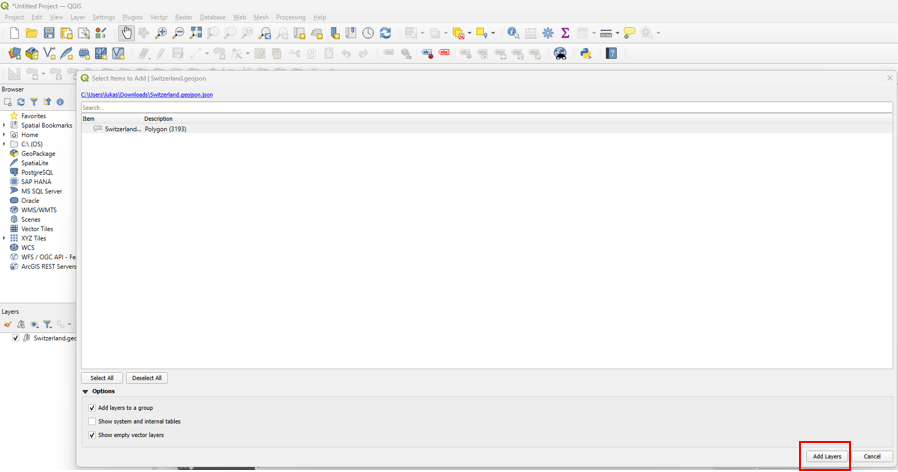
- Next: You will see the number of detected Polygons. In my case, it is 3193 Polygons showing Swtzerland’s 4-digit postal codes
- Click on Add Layers
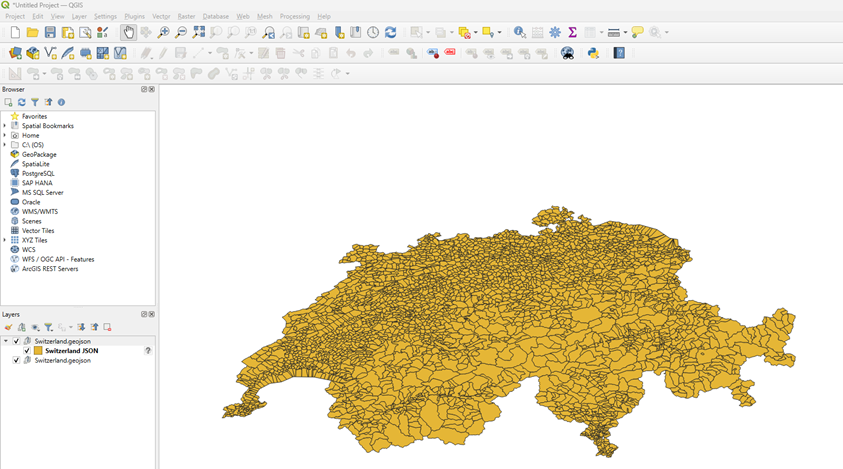
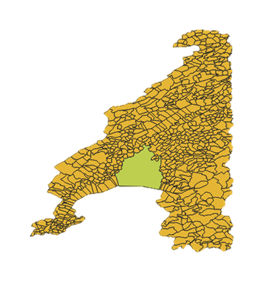
Now you can see a beautiful map of the 4-digit postal codes of Switzerland:
3. Open Attribute Table
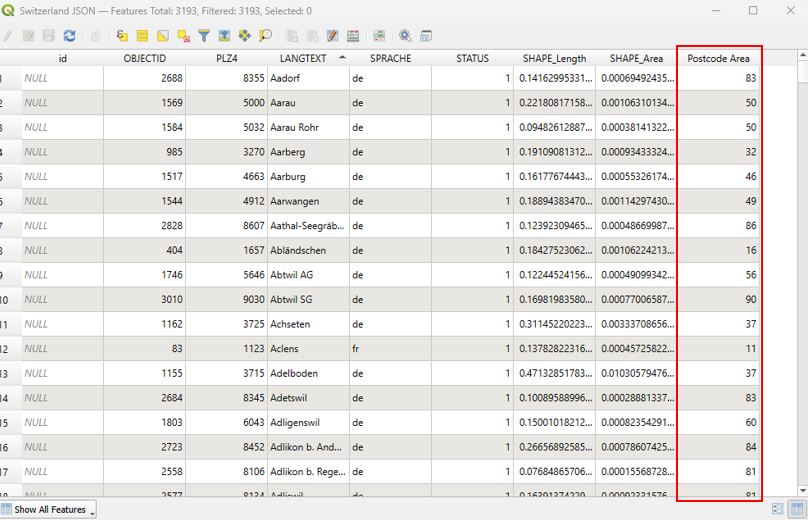
The Attribute Table in QGIS displays data associated with each feature in a layer. It’s organized in a spreadsheet-like format, with rows representing individual features (like polygons) and columns displaying different attributes (like names, area sizes, or specific codes). You can view and edit the data, perform queries to select features or create new attributes. It’s a crucial tool for managing and understanding the data within your map layers, allowing you to look deeper into the specifics of each feature you’re working within QGIS.
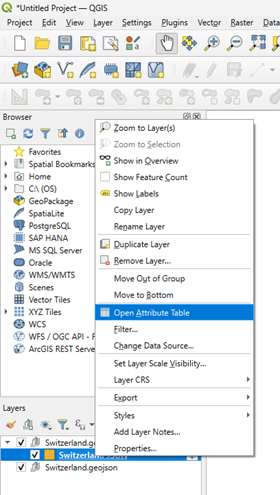
- Right click on the newly created layer
- Open Attribute Table
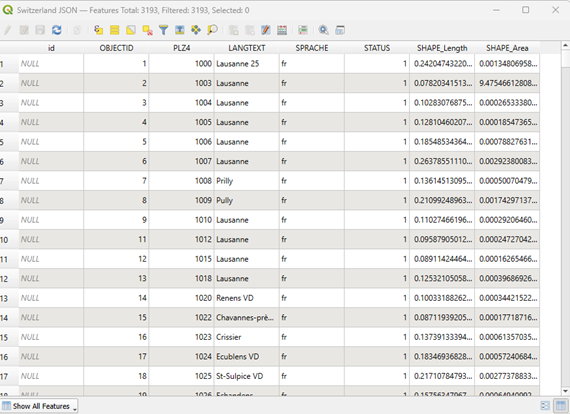
Now you can see the table and its columns: As you can see we have information about id, object ID, PLZ4 (which is our 4-digit postal code), the name of the city, the language they speak in this area and the shape length. For us, the most important feature is the PLZ4 column. Based on that we will later merge Polygons in QGIS.
4. Create a new column for Postal Code Area (2-digits)
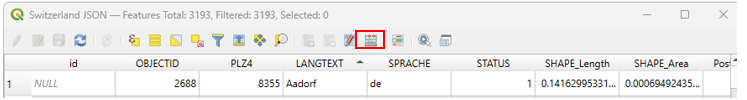
- Click on Field Calculator on the top of the Attribute Table
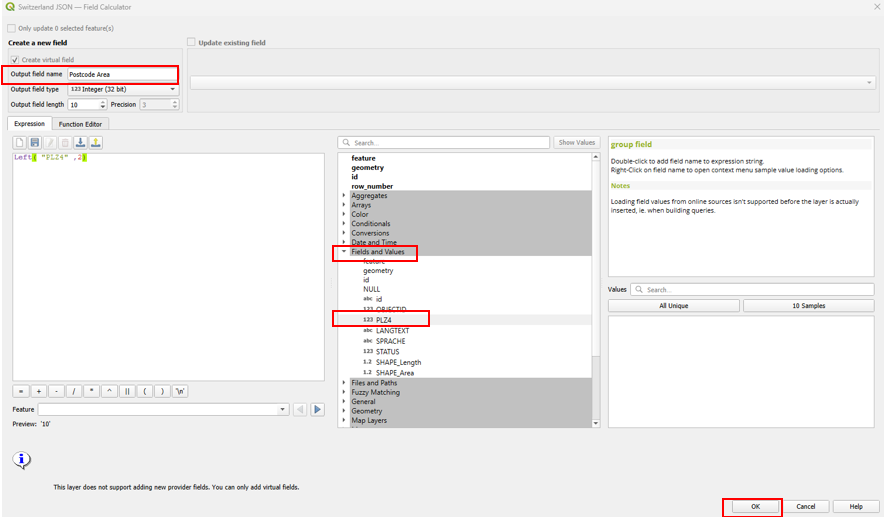
- Enter Output field name
- Go to fields and value and select PLZ4 (the 4 digits postcodes)
- You can also see the column types, here it is a number
- Enter formula: Left (“PLZ4”,2) to get first two digits!
- Click OK
Now we have a new column with Postalcode Area. Based on that we can merge all polygons with the same 2-digit number!
5. Select Multiple Polygons
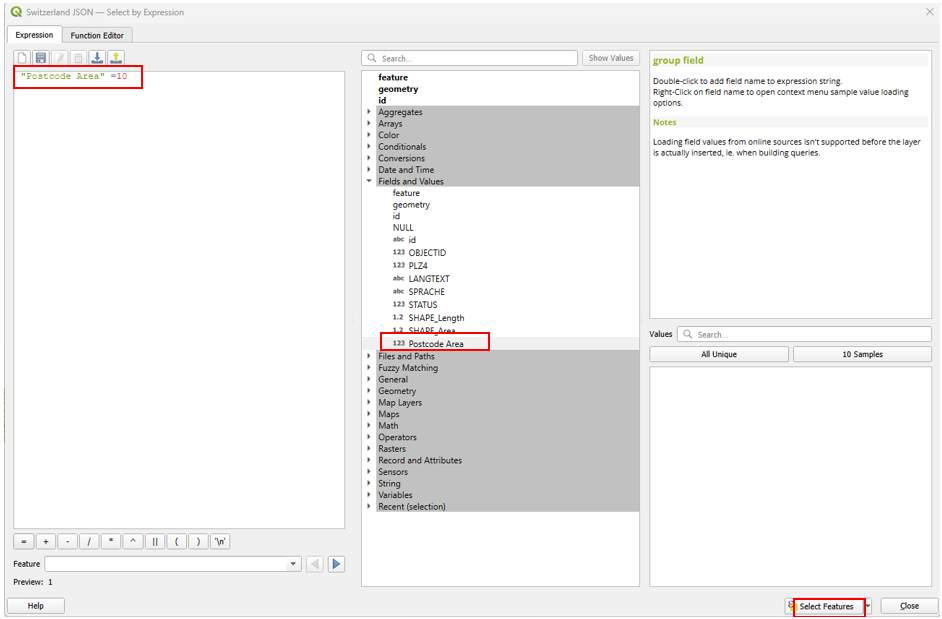
Now, we don’t want to manually go over each polygon and select the matching polygons of one postcode area. What is the smartest way to select all polygons starting with “10” in the postcode area? The solution: We are going to make use of the “Select Features using an expression” functionality

- Click on Select Features using an expression from Attribute Table
- Choose on fields and values and select Postcode Area
- Let’s select all Postcode Area starting with 10 –> Formula: “Postcode Area” = 10
- Click Select Feature
Now only Postal Codes starting with “10” are selected!

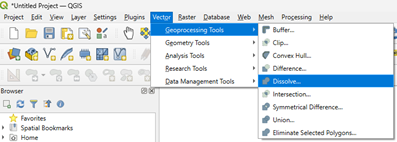
6. Merge Polygons using Dissolve in QGIS
- Vector –> Geoprocessing Tools –> Dissolve
- Select correct Input Layer (your source file)
- Check mark Select Features Only
- Click on run and then close the window
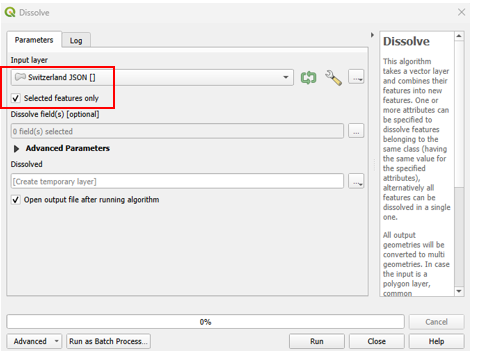
Now all polygons starting with 10 are merged in QGIS:
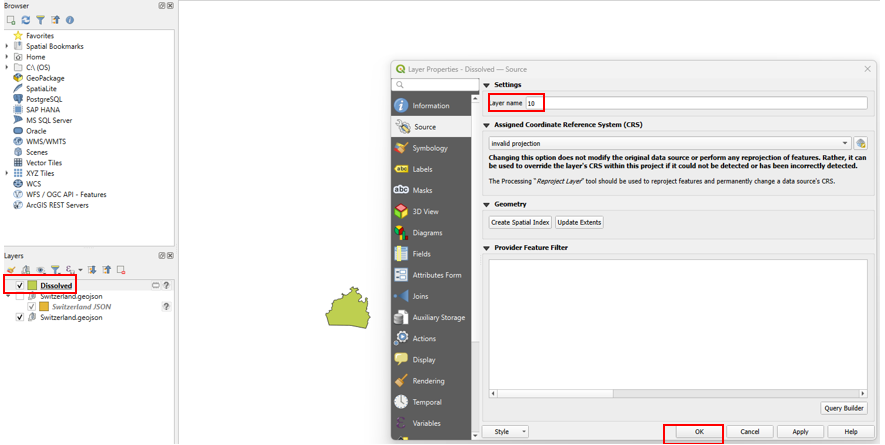
7. Rename New Layer
In step number 6 we created a new layer which you can see on the left side of the QGIS desktop application. The standard name will simply be “Dissolved”. But if we are merging all the postal codes of Switzerland we will almost end up with around 100 polygons. That is why it is important to rename the newly created layer, to make it less confusing!
- Click on new layer “Dissolved”
- Rename the New Layer “Dissolved” into something more meaningful like “10”
- Click OK
- Repeat step 4 for Postal code area 11, 12, 13 and so on until all other polygons are merged
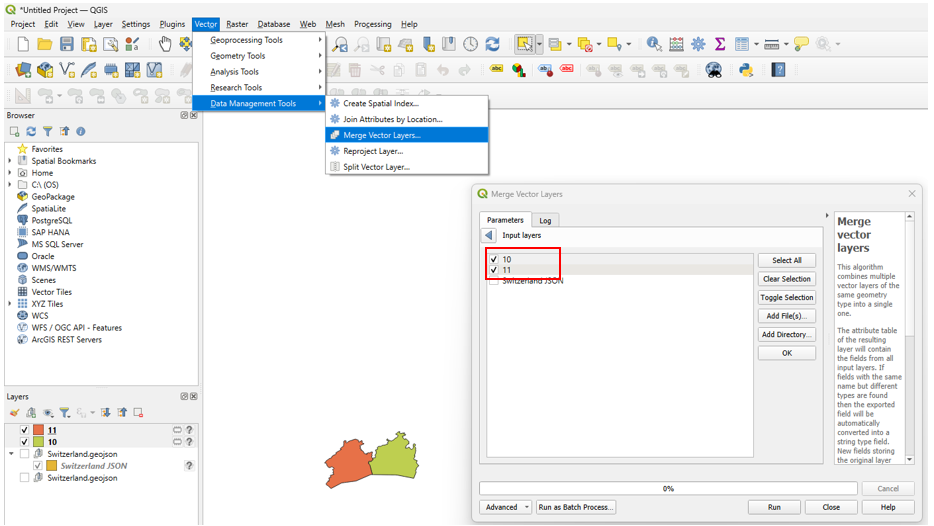
8. Merge Vector Layers in QGIS
Every time we merge polygons together, we will create a new layer. Simply follow step 6 as often as you need to create the desired polygons. In the end, for Switzerland we will have around 100 layers. For demonstration purposes, I show you here how to combine two polygons. In this example, I will merge the postal code areas 10 and 11. Now you also understand why the naming is important, as we only want to combine 2 specific polygons. Without naming it would be hard to identify them in a batch of dozens of polygons!
- Vector –> Data Management Tools –> click Merger Vector Layers
- Select Layers (In this case Postalcode Areas 10 and 11) –> click Run
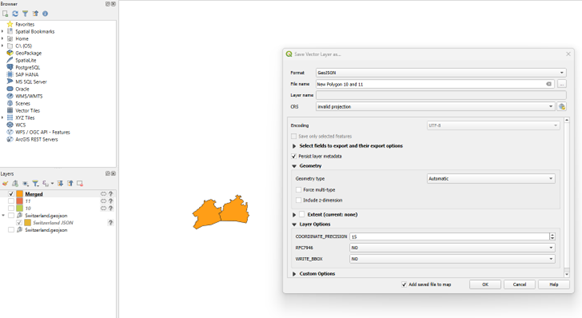
9. Safe File as GeoJson
In the last step, we want to safe our newly generated map to a GeoJson file:
- Right click –> Export –> Save Feature As…
- Choose File Format = GeoJson, select File Name and safe the file to the desired folder

Conclusion
In conclusion, merging polygons in QGIS is a powerful method for simplifying and analyzing geographic data. We’ve walked through the process using Switzerland’s postal codes as an example. This technique, particularly useful for large datasets that can slow down analysis in tools like Power BI, allows for a more efficient and strategic overview of spatial data. By understanding GIS and the role of polygons, and following the detailed steps from connecting GeoJson files to saving the final GeoJson output, users can effectively manage and interpret spatial data, enhancing their geospatial analysis capabilities.
If you want to see how to integrate GeoJson files in Power BI, I highly recommend to read my article “How to Create a Dynamic Territory Report in Power BI for Germany”
If you like this post or have a question, simply leave a comment below. Thanks!
👇
.
.
.
.
